| Log-loss ↓ | Brier ↓ | Accuracy | Points | |
|---|---|---|---|---|
| validation (2023) | ||||
| Naive (always 50%) | 0.693 | 0.250 | 52.5% | 99,670 |
| Markov (O'Malley 2008) | 0.527 | 0.178 | 72.8% | 99,670 |
| Pre-match priors only | 0.621 | 0.216 | 65.3% | 99,670 |
| Logistic regression (baseline) | 0.487 | 0.163 | 74.8% | 99,670 |
| test (2024–26) | ||||
| Naive (always 50%) | 0.693 | 0.250 | 48.6% | 232,639 |
| Markov (O'Malley 2008) | 0.498 | 0.166 | 74.9% | 232,639 |
| Pre-match priors only | 0.610 | 0.212 | 66.2% | 232,639 |
| Logistic regression (baseline) | 0.465 | 0.154 | 77.1% | 232,639 |
Does momentum exist in men’s tennis?
A point-level win-probability model on 852,000 charted points, and a pre-registered test of whether recent points predict the next one
No. Once you know the score and who the players are, the last few points tell you nothing more about who wins.
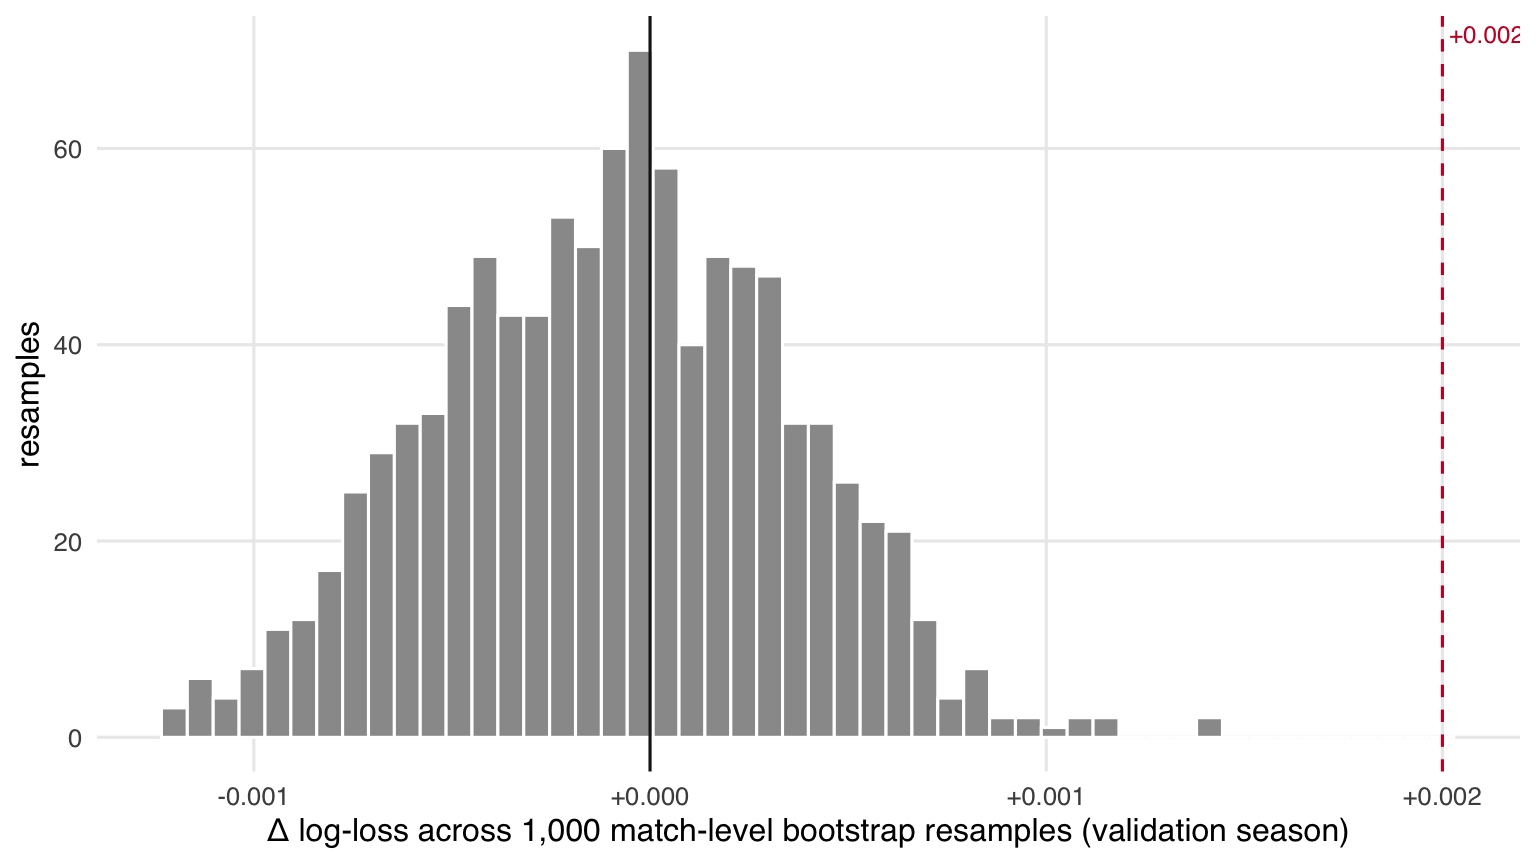
Adding momentum features to a win-probability model changed held-out log-loss by 0.00007 on 232,639 test points from 2024–2026 (bootstrap 95% CI -0.0005 to 0.0007). The pre-registered bar was an improvement of at least 0.002 with the whole interval above zero. The result on the 2023 validation season was the same.
852,160
charted points
5,280
men’s matches, 2011–2026
0.465
test log-loss, baseline model
0.00007
change from momentum
The question
Commentators talk about momentum constantly: a player “has the momentum” after a break, or “swings the match” by winning a tight tiebreak. The claim has a testable form. If momentum is real, then given the current score and the pre-match strength of both players, the recent run of points should carry extra information about who wins the match. If it is not, recent points are already fully priced into the score.
That “given the score” clause is the whole difficulty. Winning the last five points usually means you are also ahead on the scoreboard, and being ahead obviously predicts winning. A fair test needs a strong baseline that already knows the score, so momentum has to earn its place on top.
The test was pre-registered in SPEC.md before any model was fit: the features, the split, the metric, and the exact rule for declaring momentum present. The 2024+ test set was scored once, after every modelling choice was frozen on the 2023 validation season.
The baseline: a win-probability model that knows the score
Each of the 852,160 points is a row: sets, games and points for both players before the point is played, who is serving, the format (best of 3 or 5), and pre-match strength priors joined from each player’s previous 52 weeks — ranking, ranking points, and serve/return points won. Priors come strictly from before the tournament started, so a player’s performance in the match being predicted never leaks into the features.
Two baselines were built:
- Markov model — O’Malley’s (2008) closed-form probability of winning the match from any score state, driven only by each player’s serve-point win probability. No fitting; pure tennis arithmetic.
- Logistic regression — score state, priors, and the Markov probability as one input. This is the model momentum has to beat.
The ordering is the sanity check: knowing the score (Markov) beats knowing only the players (priors), and the fitted model beats pure theory. Accuracy is a blunt instrument here — a point at 5–0 in the fifth set is easy — which is why log-loss is the primary metric.
Watch the model think
Pick a match. The line is the baseline model’s probability that the player listed first wins the match, updated after every point. The step changes are what a scoreboard already tells you; the question is whether anything is left over.
Red: baseline model. Thin black: the same model with momentum features added. If momentum mattered, the two lines would separate after runs of points — they don’t. The two-sets-down Murray–Kokkinakis comeback is a good place to look.
The momentum test
Five features were added, each computed only from points earlier in the same match: the share of the last 1, 3 and 5 points won; whether the previous game was a service break; and who won the most recent set. Both models were fit on 2011–2022 and compared on identical rows. Uncertainty comes from a block bootstrap that resamples whole matches (points within a match are not independent), 1,000 times.
Every interval crosses zero, on both seasons and in every subgroup. Nothing approaches the +0.002 bar. Grass in the test years is the closest thing to a signal — and its interval still includes zero comfortably.
“But the coefficients are significant”
They are — and that is the point of pre-registering a predictive criterion rather than a p-value.
| Momentum feature | Log-odds | SE | z |
|---|---|---|---|
| Share of last 1 point won | −0.013 | 0.009 | −1.4 |
| Share of last 3 points won | −0.090 | 0.022 | −4.1 |
| Share of last 5 points won | −0.015 | 0.028 | −0.5 |
| First point of match (indicator) | 0.096 | 0.039 | 2.5 |
| Previous game was a break (+1 P1 / −1 P2) | 0.078 | 0.012 | 6.4 |
| Won previous set (+1 P1 / −1 P2) | 0.089 | 0.007 | 12.2 |
With half a million training points, tiny effects are “significant” at any conventional level. won_prev_set has a z-statistic of 12 and moves the log-odds by 0.09 — roughly two percentage points of win probability at a coin-flip score — yet the model that has it predicts no better than the one that doesn’t, because the score state already carries that information. The sign on won_last_3 is even negative: conditional on the score, having just won several points slightly lowers your chances, which is what you’d expect from regression to the mean rather than from a hot hand.
Calibration
Both models say what they mean: when the baseline says 70%, the first-listed player wins about 70% of the time. The momentum curve sits on top of the baseline curve.
What this does and doesn’t show
It shows that in charted men’s professional matches, a well-specified score-state model leaves no room for short-run momentum to improve match-outcome prediction. It says nothing about feel, confidence, or crowd energy — only that whatever those are, they don’t show up as extra predictive signal on top of the scoreboard.
Limitations, stated up front in the spec:
- Selection bias. The Match Charting Project is crowd-charted, so famous players and late rounds are over-represented. Conclusions are about charted matches; the temporal split still gives an honest forecasting test within that population.
- Priors are coarse. Rank and 52-week serve/return rates are joined for 95.8% of matches; the rest carry a missing indicator. Better priors (surface-specific Elo, head-to-head) would strengthen the baseline, which would make momentum’s job harder, not easier.
- Simplifications in the Markov model. All sets are treated as tiebreak sets at 6–6, including pre-2019 advantage final sets. This affects only the theory baseline, not the logistic model’s data.
- Momentum was operationalised five ways. A different definition (e.g. within-set runs, or momentum measured in games) could behave differently. The five here are the ones commentators actually invoke.
Reproduce it
renv::restore()
source("scripts/fetch_data.R")      # pinned upstream CSVs -> data/raw/ (never committed)
source("scripts/run_phaseA.R")      # point table, priors, Markov + LR baselines   (~3 min)
source("scripts/run_phaseB.R")      # momentum features, bootstrap, decision       (~20 s)
testthat::test_dir("tests/testthat")   # 69 tests at the model seams
Set TENNIS_FINAL=1 to score the 2024+ test set; it was run exactly once for this page. Source, spec, and every reported number: github.com/danielw4/tennis-momentum.
Data: Tennis Abstract Match Charting Project (points) and TML-Database (rankings), both CC BY-NC-SA 4.0, pinned by commit in the spec. Method reference: O’Malley, A. J. (2008), “Probability formulas and statistical analysis in tennis”, Journal of Quantitative Analysis in Sports 4(2).